From laid-back beach nuptials to black-tie affairs in grand ballrooms, weddings are the pinnacle of love, commitment, and questionable dance moves. Plus, they’re the perfect excuse to throw a big party with all your favorite people! Hey, who doesn’t love a slice of wedding cake?
But what makes a wedding really shine? Is it the venue, the food, the open bar, or maybe it’s that moment when the DJ finally plays “YMCA?”
Well, we may never know for sure, but at Shane Co. we LOVE a good wedding, so we took a deep dive to find out everything from what folks spend and guest list size to what insights, opinions, and preferences dominate the American wedding landscape.
We surveyed over 3,000 Americans and came up with some fascinating results and details you won’t find elsewhere, so read on!
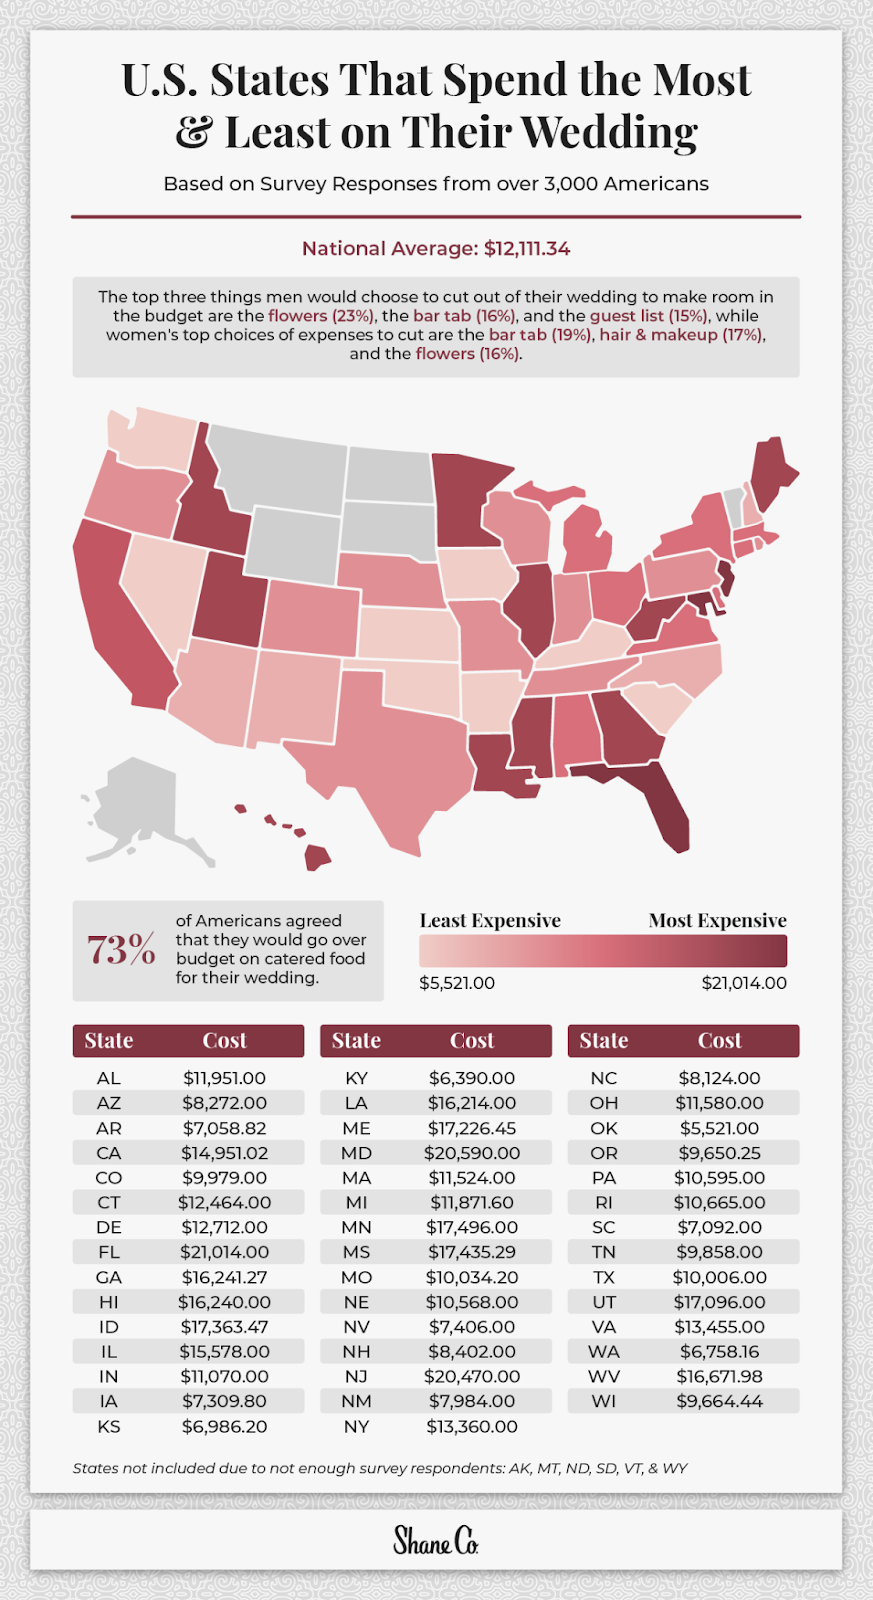
U.S. States That Spend the Most & Least on Their Wedding
The amount of money spent on a wedding doesn’t necessarily equate to its success. The true value of a wedding lies in the love and commitment shared between the couple and the celebration of that bond with their loved ones.
While a lavish destination ceremony may be beautiful and memorable, an intimate gathering of close friends and family can be just as meaningful.
In fact, (55%) of our survey respondents said that even if money weren’t a concern, they’d prefer to get married closer to home and opt out of a destination wedding. Globetrotting millennials were the only generation in which most survey respondents said they would plan a destination wedding, but only if costs weren’t a concern.
Speaking of costs, nearly three-quarters (73%) of Americans said they would go over budget on the catered food for their wedding, which says a lot about how much we care about our guests’ experience on the big day!
Our survey reveals that brides and grooms down in sunny Florida shamelessly spend the most on weddings over any other state ($21,014 on average). In contrast, Oklahomans choose to be a bit more frugal when planning a wedding. On average, respondents said they spend $5,521 for the big day.
How Every State Takes Their Weddings
Now that you’ve seen the exact numbers for each state, we created this interactive map to illustrate how they all compare and how long (or short) the average guest list is in each U.S. state.
When it comes to big weddings, there’s no denying the grandeur and excitement that come with a large guest list. Nebraska brings the party with the longest invite list in the country (93 guests on average). When you consider plus-ones, that’s a serious shindig!
On the flip side, some couples consider small weddings more intimate and personal and choose to prioritize only their closest friends and family members. Nevada and Arizona tied for the smallest guest list average with only 42 guests.
Decisions, Decisions…
Now for our favorite part! From finding a venue and setting a date to booking reception details and who to include on the big day, newlyweds-to-be face countless decisions when planning their wedding.
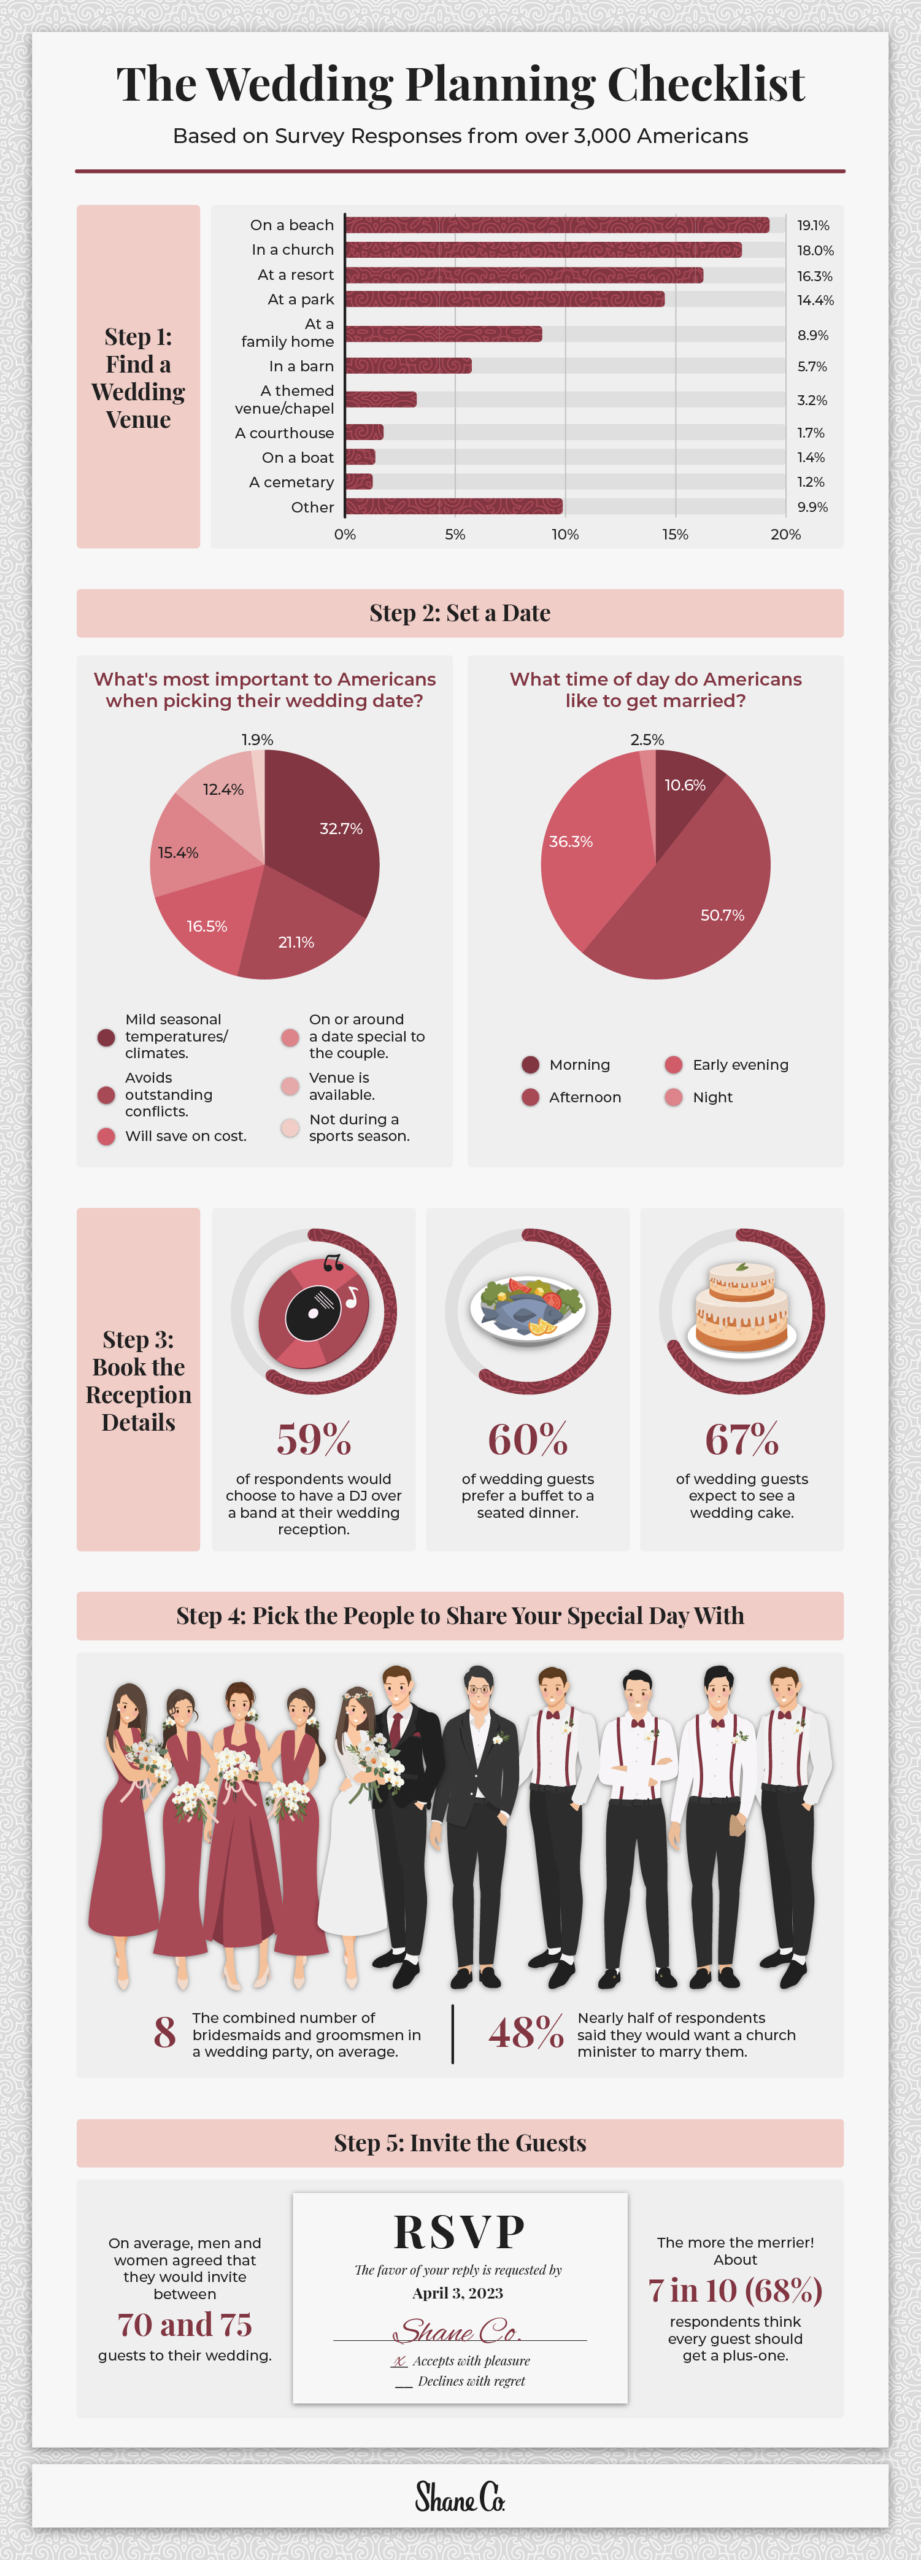
About one in five (19%) respondents prefer the open air and lapping waves of a beach wedding, while 18% prefer the classic feel of a traditional church wedding. Interestingly, Gen Zers were the most likely to opt for a church wedding. Could it be all the rom-coms they’ve seen?
Just because Americans love a beach wedding doesn’t mean they’re opting out of the traditional route. In fact, almost half of all Americans (48%) want a minister to preside over the nuptials.
Getting down to the nitty-gritty, our survey revealed some stark differences between brides and grooms. Grooms seem to love sharing their special moment with loved ones more than brides — just one in 10 grooms (11%) claimed they’d prefer a ceremony without groomsmen, while almost one in four brides (24%) said they would skip bridesmaids altogether on their big day. Also, most men (62%) can’t stand the wait and want to see the wedding dress before the aisle, while most women (52%) definitely want to keep that special dress a surprise!
Closing Thoughts
It’s clear from our survey that couples have lots to consider when it comes to tying the knot, and not everyone agrees on what makes a perfect wedding. From finding a suitable venue that some bridezilla hasn’t already snatched up, to selecting the right caterers and a killer DJ to keep the party rocking, weddings are no small undertaking.
But at the heart of it all, it’s the sincere emotion that permeates every aspect of a wedding that makes them such special days. Whether it’s the tears in a father’s eyes as he walks his daughter down the aisle, the contagious joy of the couple as they exchange vows, or the warmth of a hug from a friend you haven’t seen in years, weddings are a reminder of the incredible power of human connection.
If you’re getting ready to pop the question and feeling overwhelmed about picking out the perfect engagement ring, not to worry! At Shane Co., we stay on top of the latest trends, styles, and more so you don’t have to. Check out our deep dive into which engagement rings are trending in 2023!
Methodology
In late 2022, we surveyed 3,014 people from across every state to gather information on their wedding day preferences regarding location, date, time, and much more. Data in hand, we analyzed the results to identify regional variations in wedding plans and determine which trends, preferences, and customs stood out. It’s worth noting that due to their lower populations, we did not receive enough responses from Alaska, Montana, North Dakota, South Dakota, Vermont, and Wyoming to gain meaningful insights into their wedding preferences.