What’s your best bet for comfort food when the weather gets chilly? Chili, of course! But wait, do you prefer beans in your chili, or do you take it sans beans? Do you like ground beef, ground turkey, or no meat at all? Is cornbread your ideal side?
Heated questions like these have long stirred division, not just between Americans from state to state, but among couples seeking the warmth and comfort that only a steaming bowl of chili can provide. Because ways to make chili are as plentiful as couples who disagree about the best way to make it, we surveyed 2,000+ Americans across the U.S. to find out how each state cooks its chili and got some fascinating results.
The Ideal Bowl of Chili
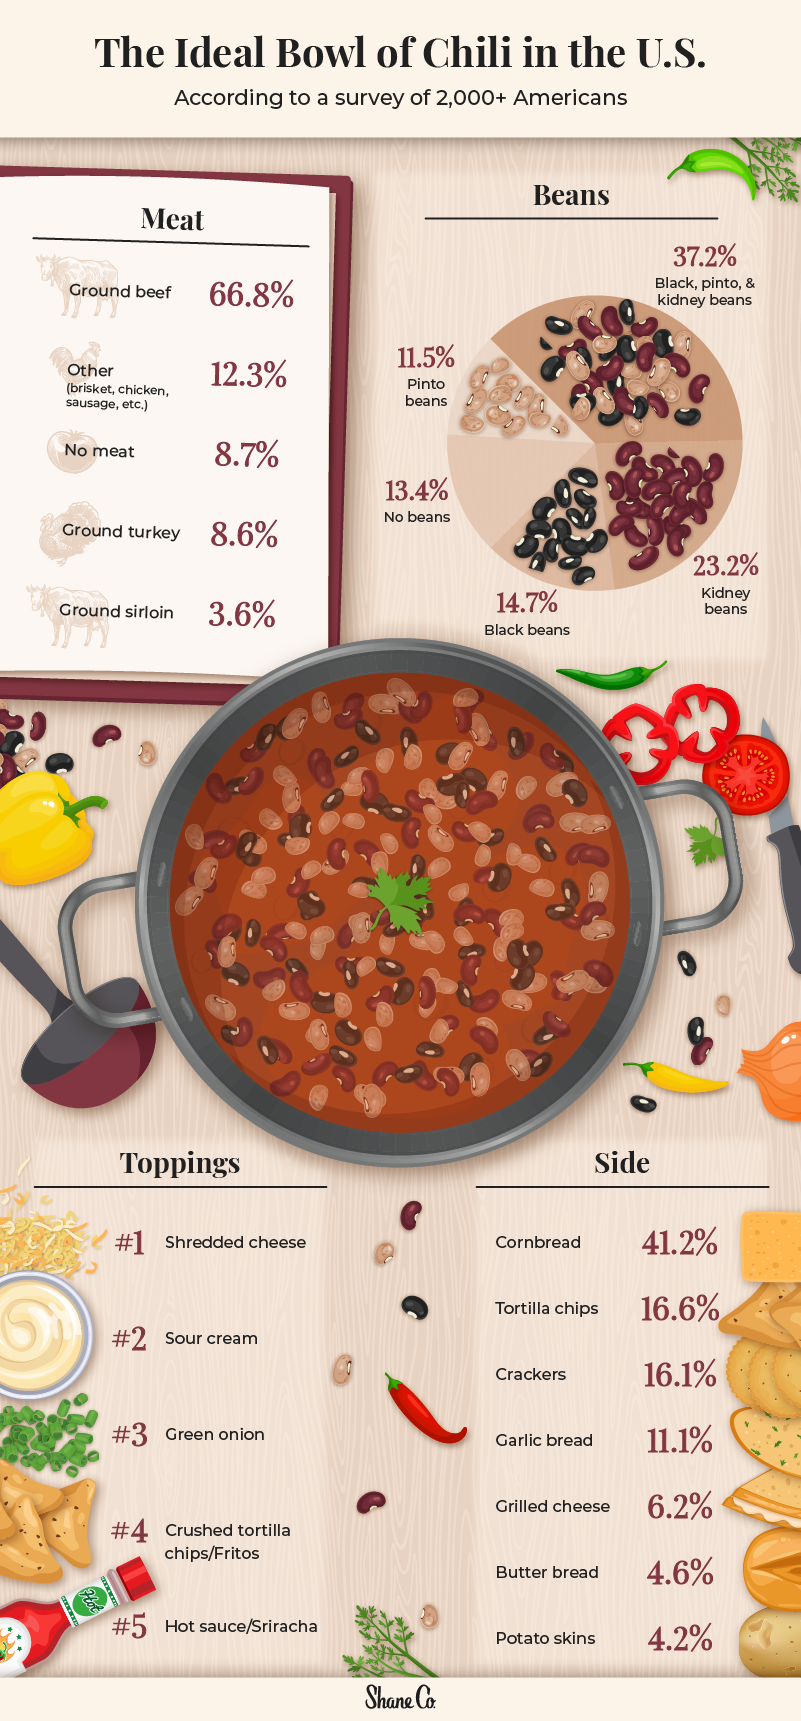
No matter how you like your chili, it’s always a satisfying meal, and our survey shows that Americans have diverse preferences for what goes into their chili pot.
Ground beef dominates the popular meat category and is the favorite for two out of three Americans. But did you know 22% of the world population identifies as vegetarian? That’s why it’s no surprise that 8.7% of Americans prefer meat-free chili.
When it comes to the age-old bean debate, the classic black, pinto, and kidney bean combo is the only way to go, according to 37.2% of those we surveyed. Of course, those results might make you cringe if you’re from the Lone Star State — Texas chili is famously bean-free. Still, no-bean chili remains the favorite of many chili fans, accounting for 13.4% of our survey respondents.
Toppings-wise, shredded cheese is the number one essential chili topping Americans reach for, with sour cream and green onions following close behind. If you ask us, you can’t go wrong with generous amounts of all three!
What about sides? Cornbread is the preferred side for most Americans (41.2%), but tortilla chips and crackers are also popular.
Local Chili Favorites
Now that we’ve looked at the overall chili preferences nationwide, let’s focus the lens on individual states to see what makes their bowls of chili unique.
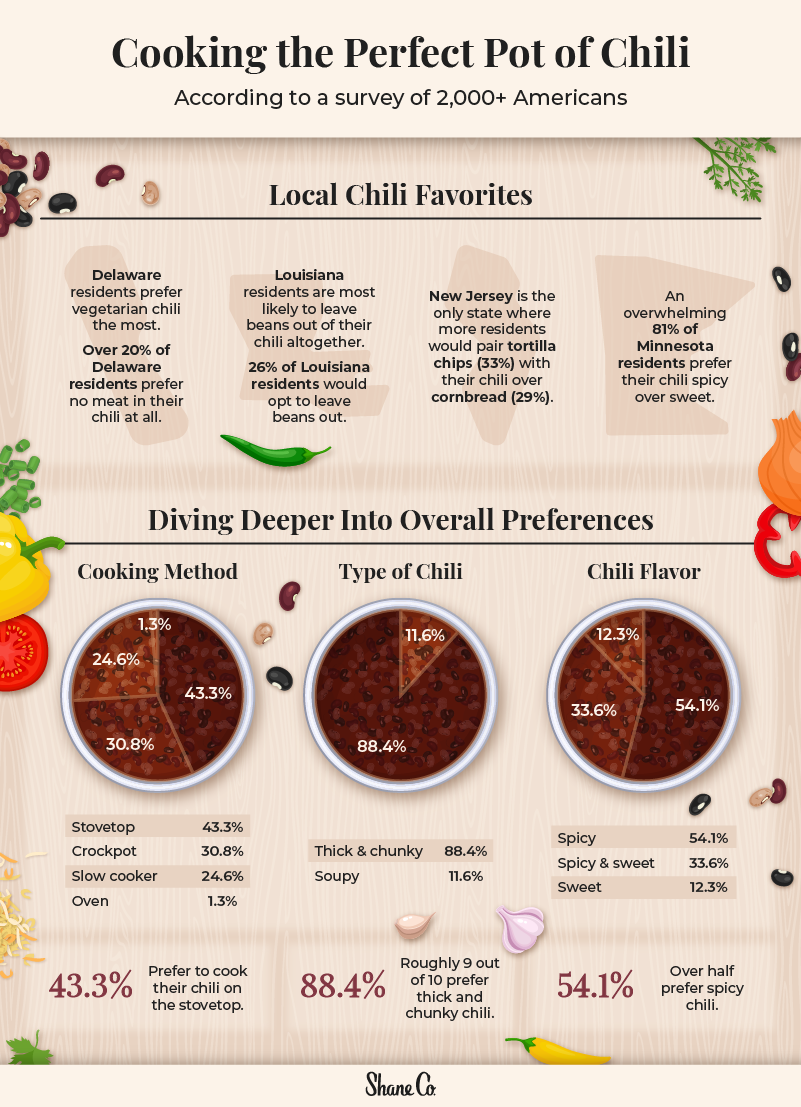
Delaware residents lead the U.S. with a strong preference for vegetarian chili. In fact, about 20% of people in Delaware prefer a meatless chili, compared to only 8% of the general population.
Meanwhile, when it comes to the bean debate, Louisiana residents feel even more strongly than Texans and are most likely to leave beans out of their chili altogether. Over a fourth of Louisiana residents (26%) prefer bean-free chili, compared to just 13% of respondents nationwide.
New Jersey stands out as the only state where more residents opt for tortilla chips (33%) over cornbread (29%) with their chili (just 16% of the nation prefers tortilla chips).
According to our survey, Minnesotans like to spice things up! A whopping 81% of them prefer their chili spicy, while nationwide, only 54% of us are brave enough to handle the heat.
Lastly, we found that most Americans (nine of every 10) are all about that thick and chunky chili life and that stovetop chili cooking beats out every other method.
The Most Common Chili Recipe in Every State
Want the nitty gritty on your state’s preferred chili combinations? Just hover above the map below for the details!
Closing Thoughts
All in all, the great chili debate is alive and well in the U.S.! No matter how you like your chili, our study shows that Americans have strong preferences for their favorite combinations of ingredients.
The best kind of winter date-night-in is one snuggled on the couch with your soulmate eating warm comfort food! Another way to warm the heart of your significant other is by picking out a special gift for them at Shane Co. Whether you’re looking for something timeless or 100% unique, we have a wide selection of pieces certain to make your loved one’s heart melt.
Methodology
To find out how Americans prefer their chili, we surveyed 2,070 respondents across multiple demographics and 44 states in December of 2022. Alaska, Montana, North Dakota, South Dakota, Vermont, and Wyoming are not included in the insights due to a low pool of survey respondents.