At Shane Co., we feel honored to be a part of so many engagements each year. Getting engaged is a huge milestone, and with so many components and decisions leading up to getting engaged, it’s no wonder there are so many traditions surrounding it.
Tradition helps us determine how to act in situations we might not know how to navigate otherwise. They are not set in stone (forgive the pun), however, and often have interesting, meandering histories. Did you know that men kneeling to propose might have originated in the Medieval era with men devoting themselves to their Earthly ideal, often a noblewoman? That’s why it’s so appealing for us to find out what proposals look like today. How many of these traditions have lasted and how many have changed with the times?
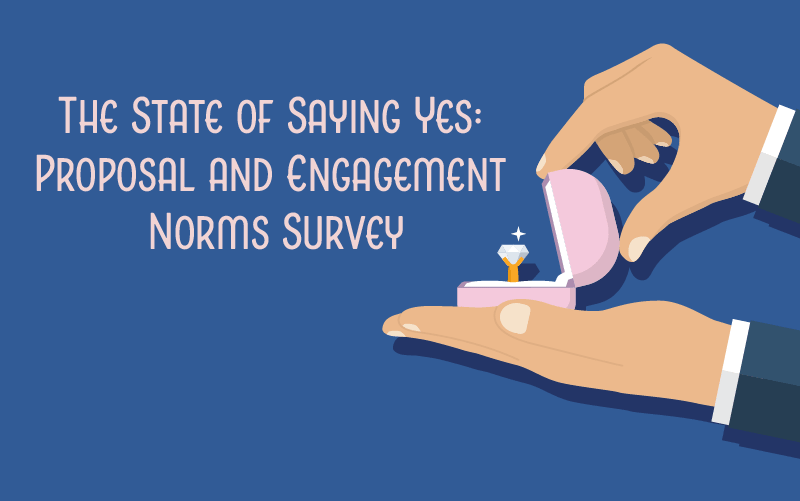
We decided to conduct a survey to determine what proposals and engagements look like today in the United States. We surveyed 1,376 married or engaged U.S. adults about what their proposals, from the relationship beforehand to the photos taken after looked like.
Read on to discover our findings!
Average Relationship Timelines
First, we decided to dive into what relationships, from the first date to the wedding day, look like on a timeline. We asked our participants how long they dated their partner before they got engaged, how long they lived together before their engagement (if they did), and how long their engagement lasted. We then broke down each segment into averages by generation and by sexual orientation.
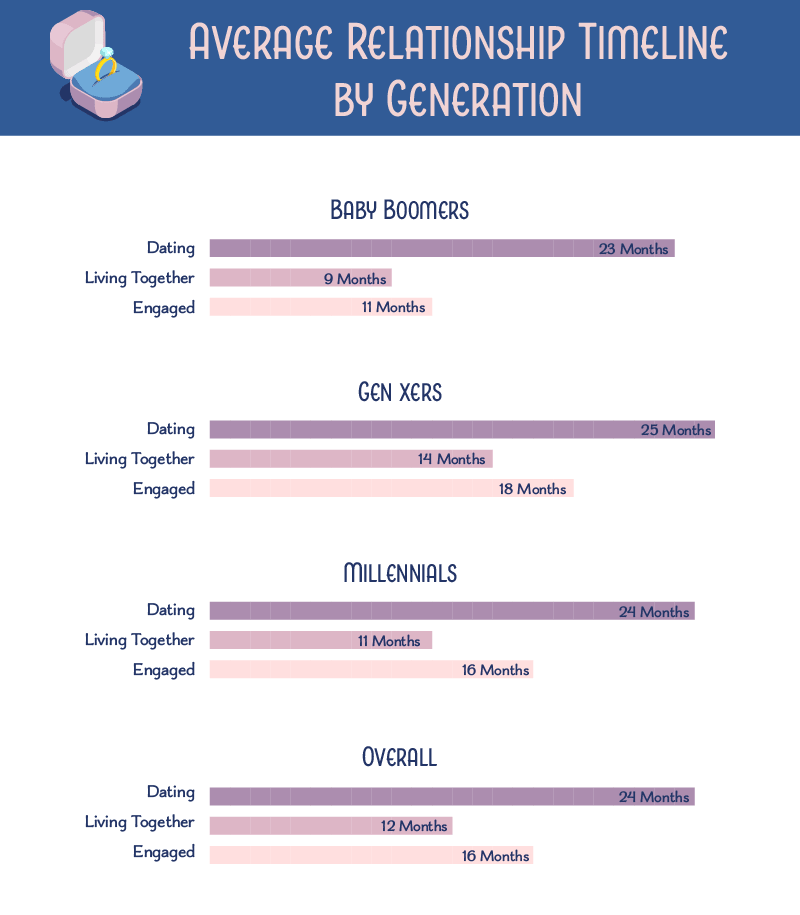
So what does the average relationship timeline look like by generation? According to our findings, Gen Xers had the longest relationships before getting engaged, with an average of 25 months or just over 2 years. Couples of the “latchkey generation,” which is noted for its emphasis on independence and individualism, lived together the longest before getting engaged, with an average of 14 months.
We also found it remarkable how engagement lengths have varied greatly over the generations. Baby Boomers were engaged for less than a year on average, while Gen Xers were engaged for 18 months. Millennials had engagement periods of around 16 months, which is the average overall. We suppose Gen Z will determine whether the average engagement period increases or decreases over time!
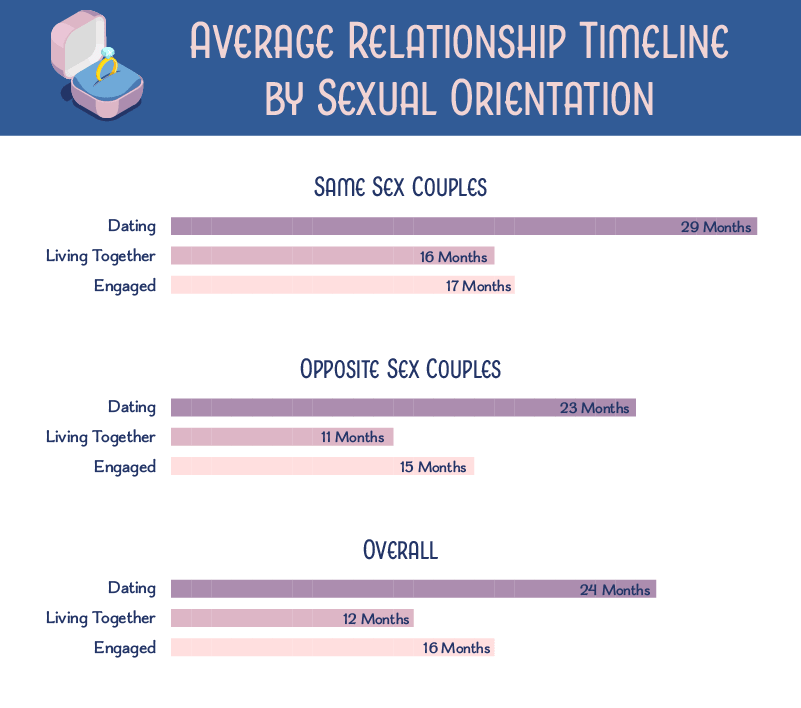
Similarly, we observed differences between the relationship timelines of opposite-sex and same-sex couples. Same-sex couples dated for much longer before getting engaged, an average of 29 months, which, of course, must be considered in the light of marriage equality in the United States. Same-sex couples also had longer engagement periods and lived together longer than opposite-sex couples.
Of course, there are many other reasons engagements and relationships prior to marriage might look different among various couples. We also asked questions about our respondents’ lives when they got engaged; what stage of life were they in when they became affianced?
Life Around Engagement
As engagements and proposals have changed, so have the lives of those getting engaged. More often than ever, couples may own a home together or have children together before they get engaged. After all, there isn’t one right way to get engaged!
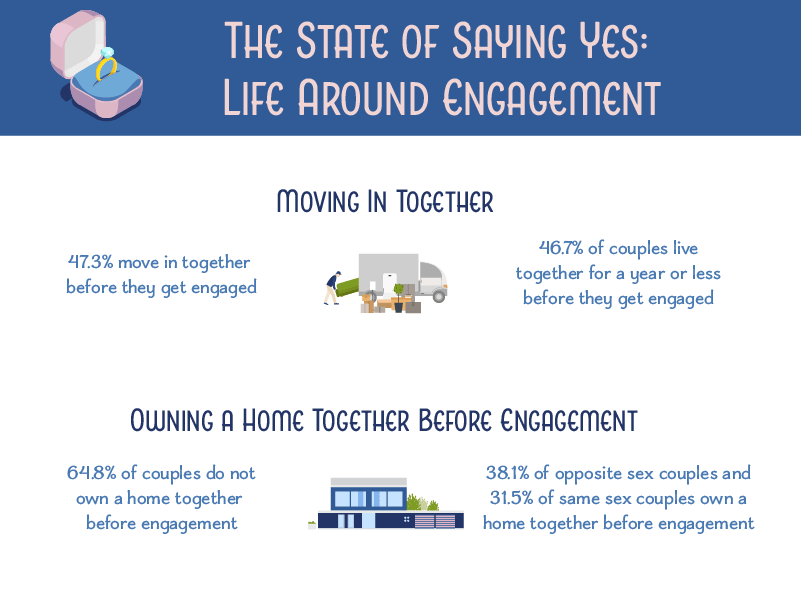
In fact, traditions aside, 47.3% of couples moved in together before they get engaged. Although they tended to live together for a relatively short period (46.7% lived together for a year or less before getting engaged), living together is a noteworthy precursor to getting engaged.
While the majority of couples surveyed did not own a home together before getting engaged, our results indicated that opposite-sex couples (38.1%) were more likely than same-sex couples (31.5%) to close on a house before their wedding day.
Popping the Question
Picture a proposal in your head. We’d venture to bet the image that comes to mind involves a man on one knee, a diamond ring, and a wonderfully surprised girlfriend. Of course, popping the question has a highly traditional element to it. But are people today following tradition?
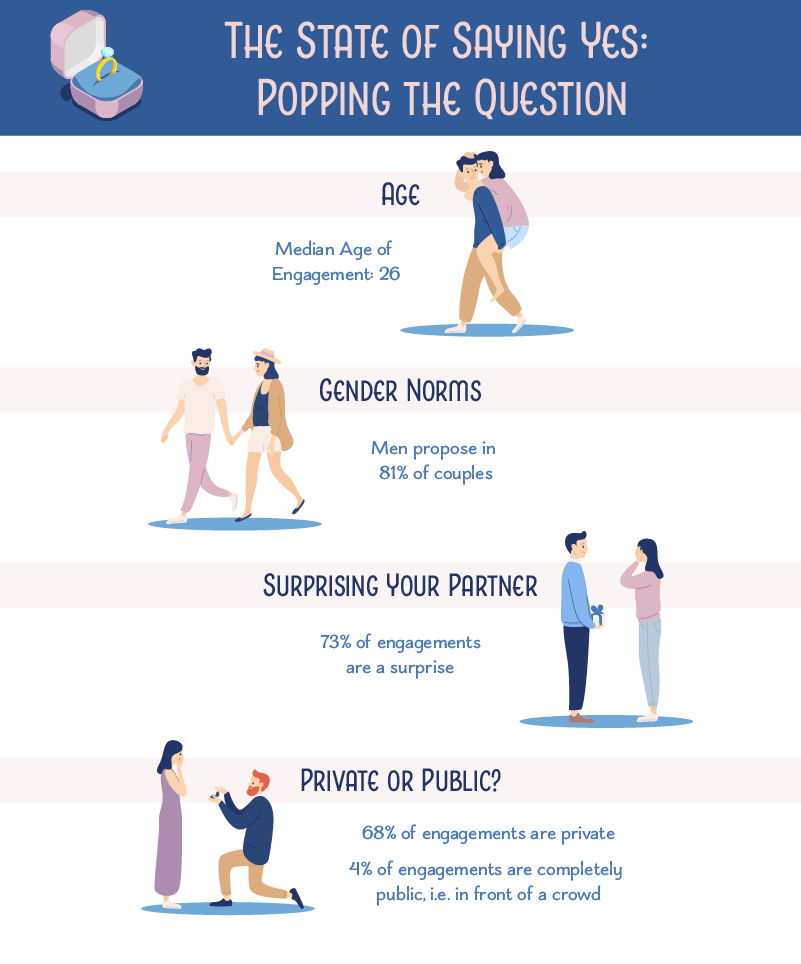
The median engagement age of our respondents was 26, close to the national average of 28 for women and 30 for men. This stat is on trend that the age at first engagement has been steadily increasing for decades. In 81% of couples, the standard picture of men doing the proposing remains accurate, as does the element of surprise, which is still the case in 73% of engagements.
A feature of 21st-century engagements is their public setting, such as at sports games or concerts. However, the fact remains that 68% of engagements are private, with only 4% of engagements taking place in a highly public manner.
The Ring
It’s no surprise that at Shane Co., we have a huge interest in the ring part of engagements. Not just in the most popular stone or setting chosen, but the cultural norms that surround them. Historically, it was expected for a male fiancé to purchase a ring, which he gifted to his betrothed for her to wear throughout the engagement period.
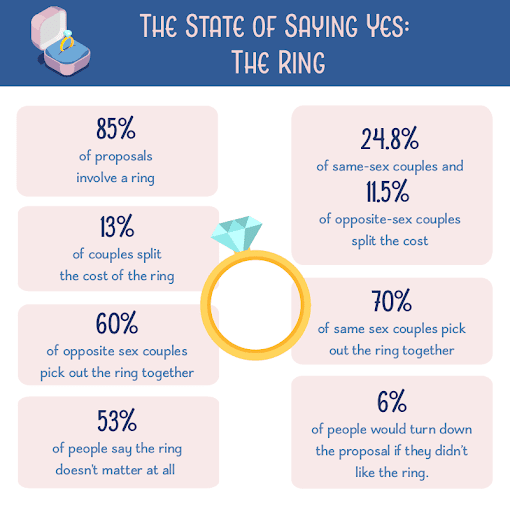
Naturally, things have changed over time. 85% of proposals still involve a ring, with 13% of couples splitting the cost of that ring. When you break it down by sexual orientation, 24.8% of same-sex couples and 11.5% of opposite-sex couples split the cost of the ring.
Shopping for engagement rings has changed too. 60% of opposite-sex couples and 70% of same-sex couples pick the ring out together, instead of one partner choosing for the other. When it comes to getting engaged, however, 53% say the ring doesn’t matter at all, while 6% of people would turn down the proposal if they didn’t like the ring.
Finally, we decided to take a look at how deeply some popular engagement trends of recent decades have influenced proposals.
Engagements and Culture

Popping the question is a huge moment. It can be the culmination of months of planning and years of being together. There’s also plenty to consider when it comes to culture and trends: will you ask your partners’ parents’ permission? Will you have a photographer present? Will it be exactly how you and how you envision your partner always wanted?
Interestingly, though only 4% of engagements are fully public, 56% of people reported that they would prefer a public proposal. Even still, only 19% of engagements have a photographer present to capture the moment, although having engagement photos taken after the fact have become increasingly popular with each generation.
Still erring on the side of traditional, 52% of people ask for parents’ permission before proposing. Unfortunately, 22% of respondents stated their proposal was not exactly what they wanted. Luckily that means more than three-quarters of people DO have the engagement of their dreams.
What About You?
We’d love to hear your thoughts on our survey results, as well as hear about your own experiences with proposals and engagement norms. What did your engagement look like? Did you follow tradition or do something completely your own? Did you have an awesome photoshoot, or are those memories simply left in your head? We welcome your comments and pictures via email (social@shaneco.com) or on social media (@shanecompany).